

Coalinga College has determined the following standards by which to assess the institution. Institution set standards are levels identified by Coalinga College to be acceptable. Institution-Set Standards are reviewed and assessed on a three-year cycle.
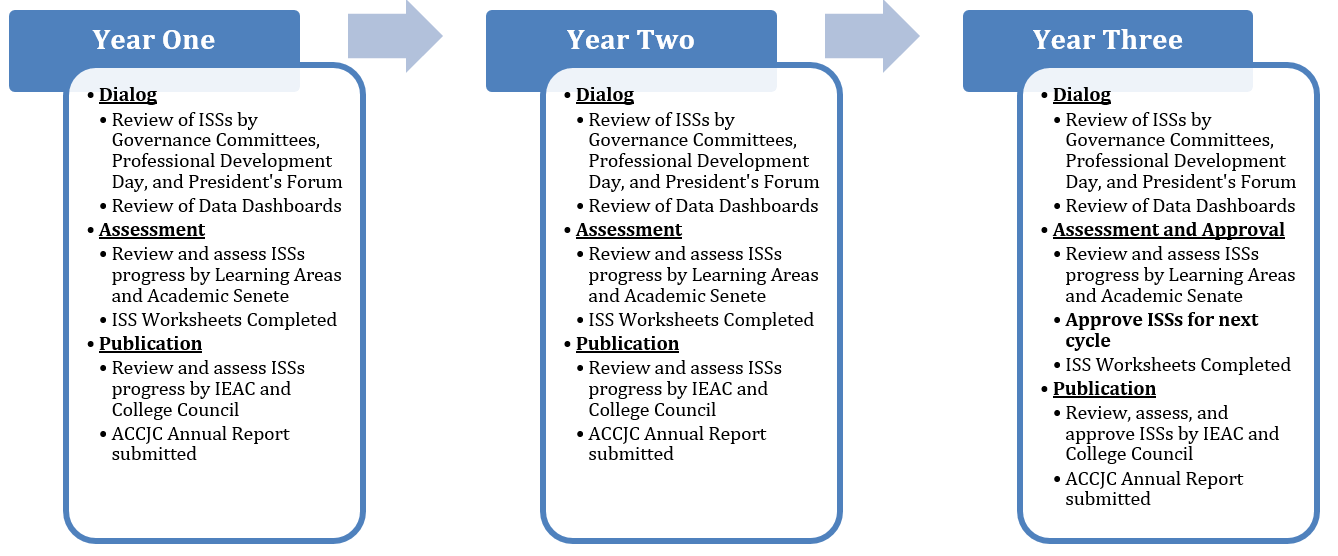
ISS Cycle Timeline
| 2017-18 | Initial Year of Cycle - Standards Set |
| 2018-19 | Assessment Year |
| 2019-20 | Revision/Approval Year |
| 2020-21 | Assessment Year |
| 2021-22 | Assessment Year |
| 2022-23 | Revision/Approval Year |
| 2023-24 | Assessment Year |
| Institution-Set Standard (Minimum Acceptable Performance) | Stretch Goal | Actual Rate 2017-18 | Actual Rate 2018-19 |
Actual Rate 2019-20 |
Actual Rate 2020-21 | Actual Rate 2021-22 | Actual Rate 2022-23 | |
|---|---|---|---|---|---|---|---|---|
| Course Success Rate | 70% | 75% | 73% | 76% | 76% | 76% | 76% | 76% |
| Degrees Awarded | 325 students per year | 400 students per year | 287 students | 360 students | 325 students | 347 students | 346 students | 339 students |
| Certificates Awarded | 300 students per year | 360 students per year | 254 students | 266 students | 143 students | 312 students | 325 students | 294 students |
| Completion of Degree, Certificate of Achievement or Transfer within Three Years | 25% | 35% | Fall 2017 Cohort 29.3% (n-size 570) | Fall 2018 Cohort 29.2% (n-size 559) | Fall 2019 Cohort 26.1% (n-size 568) |
Fall 2020 Cohort 31.9%** (n-size 379) |
Fall 2021 Cohort 26.7%** (n-size 442) | Fall 2022 Cohort 7.5%** (n-size 507) |
| Transfers to Four-Year Institutions | 350 transfers per year | 450 transfers per year | 261 transfers | 317 transfers | 376 transfers | 395 transfers | 398 transfers | 317 transfers |
**Cohort has not had a full three years to complete the metric.
|
Licensure Pass Rates |
Institution-Set Standard (Minimum Acceptable Performance) | Stretch Goal | Actual Rate (2017) | Actual Rate (2018) | Actual Rate (2019) | Actual Rate (2020) | Actual Rate (2021) | Actual Rate (2022)** |
|---|---|---|---|---|---|---|---|---|
|
Psychiatric Technician |
80% |
90% |
53% |
78% |
83% |
60% |
58% |
59% |
|
Job Placement Rates |
Institution-Set Standard (Minimum Acceptable Performance) | Stretch Goal | 2016-17 | 2017-18 | 2018-19 | 2019-20 |
|---|---|---|---|---|---|---|
| Administration of Justice | 60% | 75% | * | * | * | * |
| Business Administration | 60% | 75% | * | * | * | * |
| Child Development | 60% | 80% | * | * | * | |
| Psychiatric Technician | 83% | 90% | 88% | 98% | 98% | 86% |
| Welding | 60% | 75% | * | * | * | * |
Additional details on job placement rates, including data sources and methodology can be viewed on the WHCCD Job Placement Data page
* n-size too small to calculate job placement rate
** Most recent available data as of March 2024
Note: Data source used for Job Placement rates has changed from previous years. Currently using CTE Launchboard data, while past data were based on Perkins Core Indicators.
Archived Documents
| Learning Area ISS Data Worksheet (2020-21) |
| Learning Area ISS Data Worksheet (2019-20) |
| Learning Area ISS Data Worksheet (2018-19) |
| ISS Handout (2018) |